Is the VFD hiding a dirty filter?
Adam Gill and Dr Wichai Pattanapol from Polar Dynamix explain the relationship between filter grime, energy demand and why VFDs may conceal the issues, illustrating their case with the results of a recent modelling study.

Filter grime is one of the more familiar ventilation maintenance problems. As dust and dirt accumulate along filters, the resistance of those filters to airflow increases. In fixed-speed ventilation systems, this process results in decreased airflow, which can trigger an alarm. In ventilation systems controlled using variable frequency drives (VFDs), however, that porosity deterioration may not always be immediately obvious.
For ventilation control systems that have VFDs to maintain airflow or pressure setpoints, increasing filter resistance can trigger higher fan speeds. From an operational perspective, this is exactly what control systems are supposed to do. However, this characteristic raises an interesting maintenance question: How can the effect of increasing filter resistance on fan workload adversely affect energy costs before a noticeable loss in airflow occurs?
A recent Polar Dynamix modelling study explored VFD ventilation system behaviour using a representative industrial draw-through fan system under both clean- and heavily-loaded-filter conditions. The results were striking.
When control systems compensate
As filters get dirtier, their pressure drop increases for a given airflow rate. In fixed-speed ventilation systems, the resulting airflow reduction may provide an obvious indication that something has changed. However, with VFD control the response can be different.
In VFD-controlled systems, if airflow begins to fall, fan speed can increase to compensate for the additional filter resistance. Compared to fixed-speed systems, airflow may therefore remain nearer to its target for longer. However, under such circumstances, this is achieved by increasing fan workload.
This does not mean that VFD control is a problem; VFDs provide major benefits for airflow regulation. Instead, it means that airflow alone may not tell the whole story when assessing filter conditions and system performance.
Eventually, fans reach a point where raising their speed to maintain the desired airflow rate is no longer possible. As that operating limit is approached, VFD-controlled ventilation systems may no longer be able to compensate for increasing filter resistance, resulting in diminishing airflow.
Testing a severe filter-loading scenario
To explore this ventilation system characteristic, a 50kW industrial fan system was modelled under two conditions: a clean-filter baseline and a severe filter-loading scenario. The airflow simulations were performed using AirSketcher. The model was first checked against published wind-tunnel data to ensure that it reproduced the expected pressure drop across the filter.
The dirty-filter case was deliberately severe, with the filter porosity setting reduced from 80% in the clean baseline to 50% so as to represent heavy loading. The intention was to examine what could happen as filter resistance became significant rather than to represent a universal filter-replacement threshold.
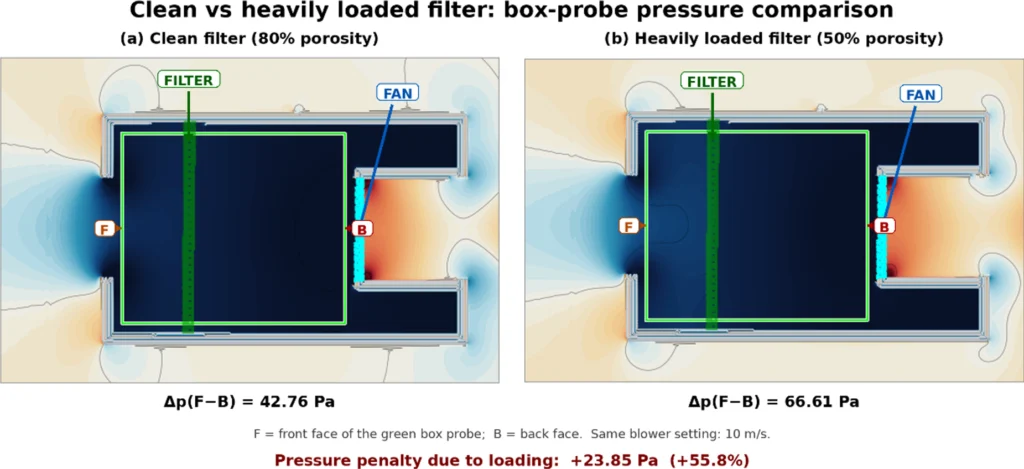
Image: Modelled fan-room performance under clean- and heavily loaded-filter conditions. In the severe loading scenario, the average front-to-back static-pressure difference increased from 42.8Pa to 66.6Pa while the specified blower-zone speed was held constant at 10m/s.
A box-probe simulation was run under the clean-filter condition. An analysis of the resulting data led to the determination that an average static-pressure difference of approximately 42.8Pa existed between the front and back of the filter.
Using the saved box-probe parameters, the simulation was rerun, this time under severe filter loading, which was simulated by reducing AirSketcher’s effective filter porosity setting from 80% to 50%.
An examination of the ensuing data led to the conclusion that the average front-to-back static-pressure difference increased from 42.8Pa to 66.6Pa while the specified blower-zone speed was held constant at 10 m/s. This represents a static-pressure differential increase of approximately 23.9Pa or 56% relative to the clean-filter condition.
Under the study’s operating assumptions, the additional fan workload associated with the increased filter resistance was estimated to represent an energy penalty of approximately 8800kWh/year. The energy value is scenario-specific and depends on factors including fan and motor efficiency, airflow, operating hours and system geometry.
These figures should not be interpreted as typical values for every HVAC or industrial ventilation system. The effect of filter loading depends on factors including filter model, fan curve, system resistance, VFD control strategy, operating hours and required airflow. Although quantifying the approximate additional energy consumption was valuable, the more useful finding of this case study was the substantial increase in aerodynamic resistance associated with severe filter loading (50% porosity) coupled with the corresponding increased burden on the fan system to maintain the airflow rate.
Looking beyond airflow
For technicians and facility operators, the study reinforces the value of looking at several indicators of a system’s condition rather than relying on a single measurement. Differential pressure across a filter remains one of the most direct ways of monitoring increasing filter resistance. That said, fan speed, power consumption and airflow can provide additional information about how a ventilation system is responding overall.
For example, if a system continues to deliver approximately the required airflow but fan speed or power demand has gradually increased, it may be worth investigating whether there is additional resistance somewhere in the air path. A filter’s condition is one possible cause. However, the state of dampers and coils, as well as duct restrictions and changes elsewhere in a system can also affect operating pressure.
A single ventilation measurement provides a system snapshot, while changes in filter differential pressure, fan speed and airflow over time can be indicators of whether a ventilation system is gradually moving away from its optimal operating condition. Hence, trend data can be particularly useful.
Where modelling can help
Those conducting routine filter maintenance do not need to apply computational fluid dynamics (CFD) as they undertake their work. Visual inspection, differential-pressure measurement and manufacturer-recommended maintenance procedures remain practical starting points. CFD modelling becomes more useful when the consequences of reduced airflow or excess energy consumption justify a closer look at ventilation system behaviour.
For larger or more complex systems, comparing clean- and loaded-filter conditions can help investigators to explore questions such as how much additional pressure a given fan must overcome, whether sufficient fan capacity remains and what may happen if airflow resistance continues to increase. It can also facilitate the examination of different maintenance scenarios before changes are made to a ventilation system.
The aim of CFD modelling is not to replace field measurement work. Instead, it is to use such measurements together with CFD modelling to better understand ventilation systems, which can support maintenance or energy decisions.
A maintenance issue with an energy dimension
Dirty filters are normally discussed in terms of airflow, indoor air quality and maintenance. In regard to VFD-controlled ventilation systems, energy performance should be included in that conversation as well; a system that is still delivering its required airflow may not necessarily be operating as efficiently as it did with a clean filter.
Monitoring filter pressure drop alongside fan speed, power consumption and airflow rate can make the increasing fan effort required to maintain airflow easier to identify before a VFD-controlled ventilation system fan reaches the point where its speed can no longer be increased to compensate for the increase in airflow resistance.
For facility managers and HVAC&R practitioners, the practical message is straightforward: optimal airflow does not necessarily correlate with optimal operating conditions; performance parameters may have deteriorated. Knowing what workload is being applied to a given fan to maintain a system’s target airflow can provide another useful indicator of whether ventilation maintenance is warranted.

Image: Adam Gill and Dr Wichai Pattanapol, Polar Dynamix
PREV
NEXT
Comments
Advertisements

Recent news
- Adam Morgan shines in Shanghai
- Next-gen solar
- Shaping the future of Building Energy Performance standards
Latest events
- Adam Morgan shines in Shanghai
- IOR opens nominations for J&E Hall Gold Medal
- Nominations open for IIR scientific prizes
Leave a Reply