 Willow Aliento
New metric for cooling degree days
As climate change shifts weather patterns around the world, researchers have recognised that new metrics may be needed to reflect cooling efficiency and better inform energy demand strategies.
A research team led by atmospheric scientists at the University of Hawai’i (UH) at Mānoa found that the yardstick of cooling degree days (CDD) which has been commonly utilised for the past century does not necessarily reflect actual conditions.
CDD is used across HVAC&R and other disciplines to estimate air-conditioning and refrigeration energy demand, however, the researchers note it assumes constant refrigeration efficiency in the calculations. This ignores the impact of temperature and humidity on efficiency.
Climate scientist and postdoctoral researcher Dr Jake Casselman and Professor Christina Karamperidou, an atmospheric sciences professor at UH Mānoa School of Ocean and Earth Science and Technology (SOEST) have proposed an efficiency-aware cooling metric, effective cooling degree days (eCDD).
This metric, described in their paper, Efficiency-weighted cooling degree days reveal opposing temperature and humidity effects on energy demand, links ambient temperature and humidity to the physical work required for cooling. It was developed through combining climate science with the physics of refrigeration engineering.
The research, published in Nature Communications, also shows that across North America, cooling efficiency has declined by 2–4% per decade since 1971. Trends in temperature and humidity in the region have also caused CDD estimates to misrepresent cooling demand.
“During hot extremes, efficiency losses are amplified under humid-heat but partially offset under dry-heat,” the paper states.
“Projections reveal a continent-scale shift in humidity regimes, with an eastward extension of dry heat that enhances cooling efficiency during extremes, while eCDD increases by 10–80%.
“These results demonstrate that temperature-based metrics alone are insufficient and efficiency-aware metrics are essential for accurately assessing cooling demand, especially considering differing electricity generation mixes.”
The legacy CDD estimation process assumes each degree of heat requires the same amount of energy to cool.
“Estimates of cooling degree days are used everywhere,” Dr Casselman explains in an article published by UH Mānoa.
“Utility companies, grid operators, energy planners, and engineers use them to anticipate electricity demand, and financial markets trade futures on them to hedge against unusually hot summers. If that yardstick is biased in ways that depend on a region’s climate, then the planning decisions built on it are biased too. That can mean building the wrong amount of power generation in the wrong place or misjudging where the grid is most at risk during a heat wave.”
Read the full article here.
Should we rethink CDD in Australia?
In Australia, the Bureau of Meteorology (BOM) calculates CDD using the temperature-only method, assigning a comfort level threshold and then calculating the number of days in an average year that exceed that threshold. The number of heating degree days and cooling degree days are based on temperature data collected between 1951 and 2020.
Overall, the northern part of the country has more cooling degree days than the south. The BOM states that Melbourne has an average annual number of CDD of around 250 with a base temperature of 18oC, while Brisbane has approximately 1000.
“For two homes with similar structure in the two cities, on average four times the energy would be required to cool a home in Brisbane than Melbourne,” the BOM states.
“This information can guide building design for more energy efficient homes through the understanding of the local conditions.”
Read more here.
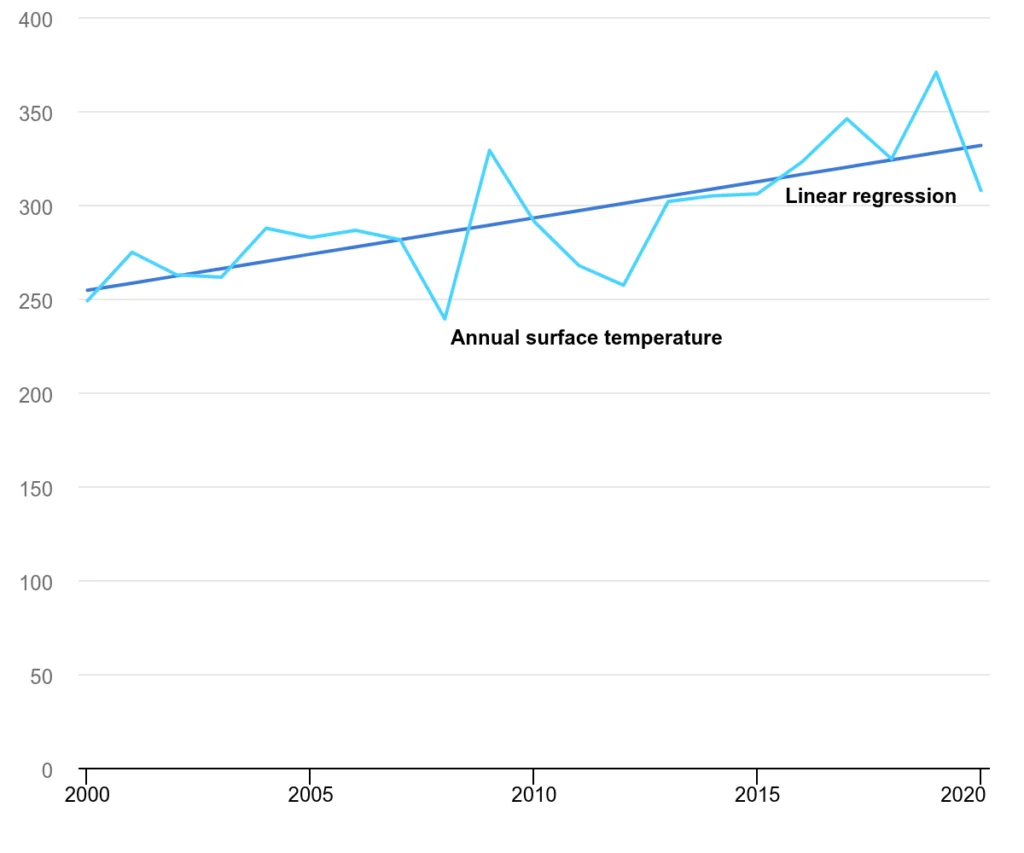
Graph: Cooling degree days 2000-2020 – Australia; Source International Energy Agency
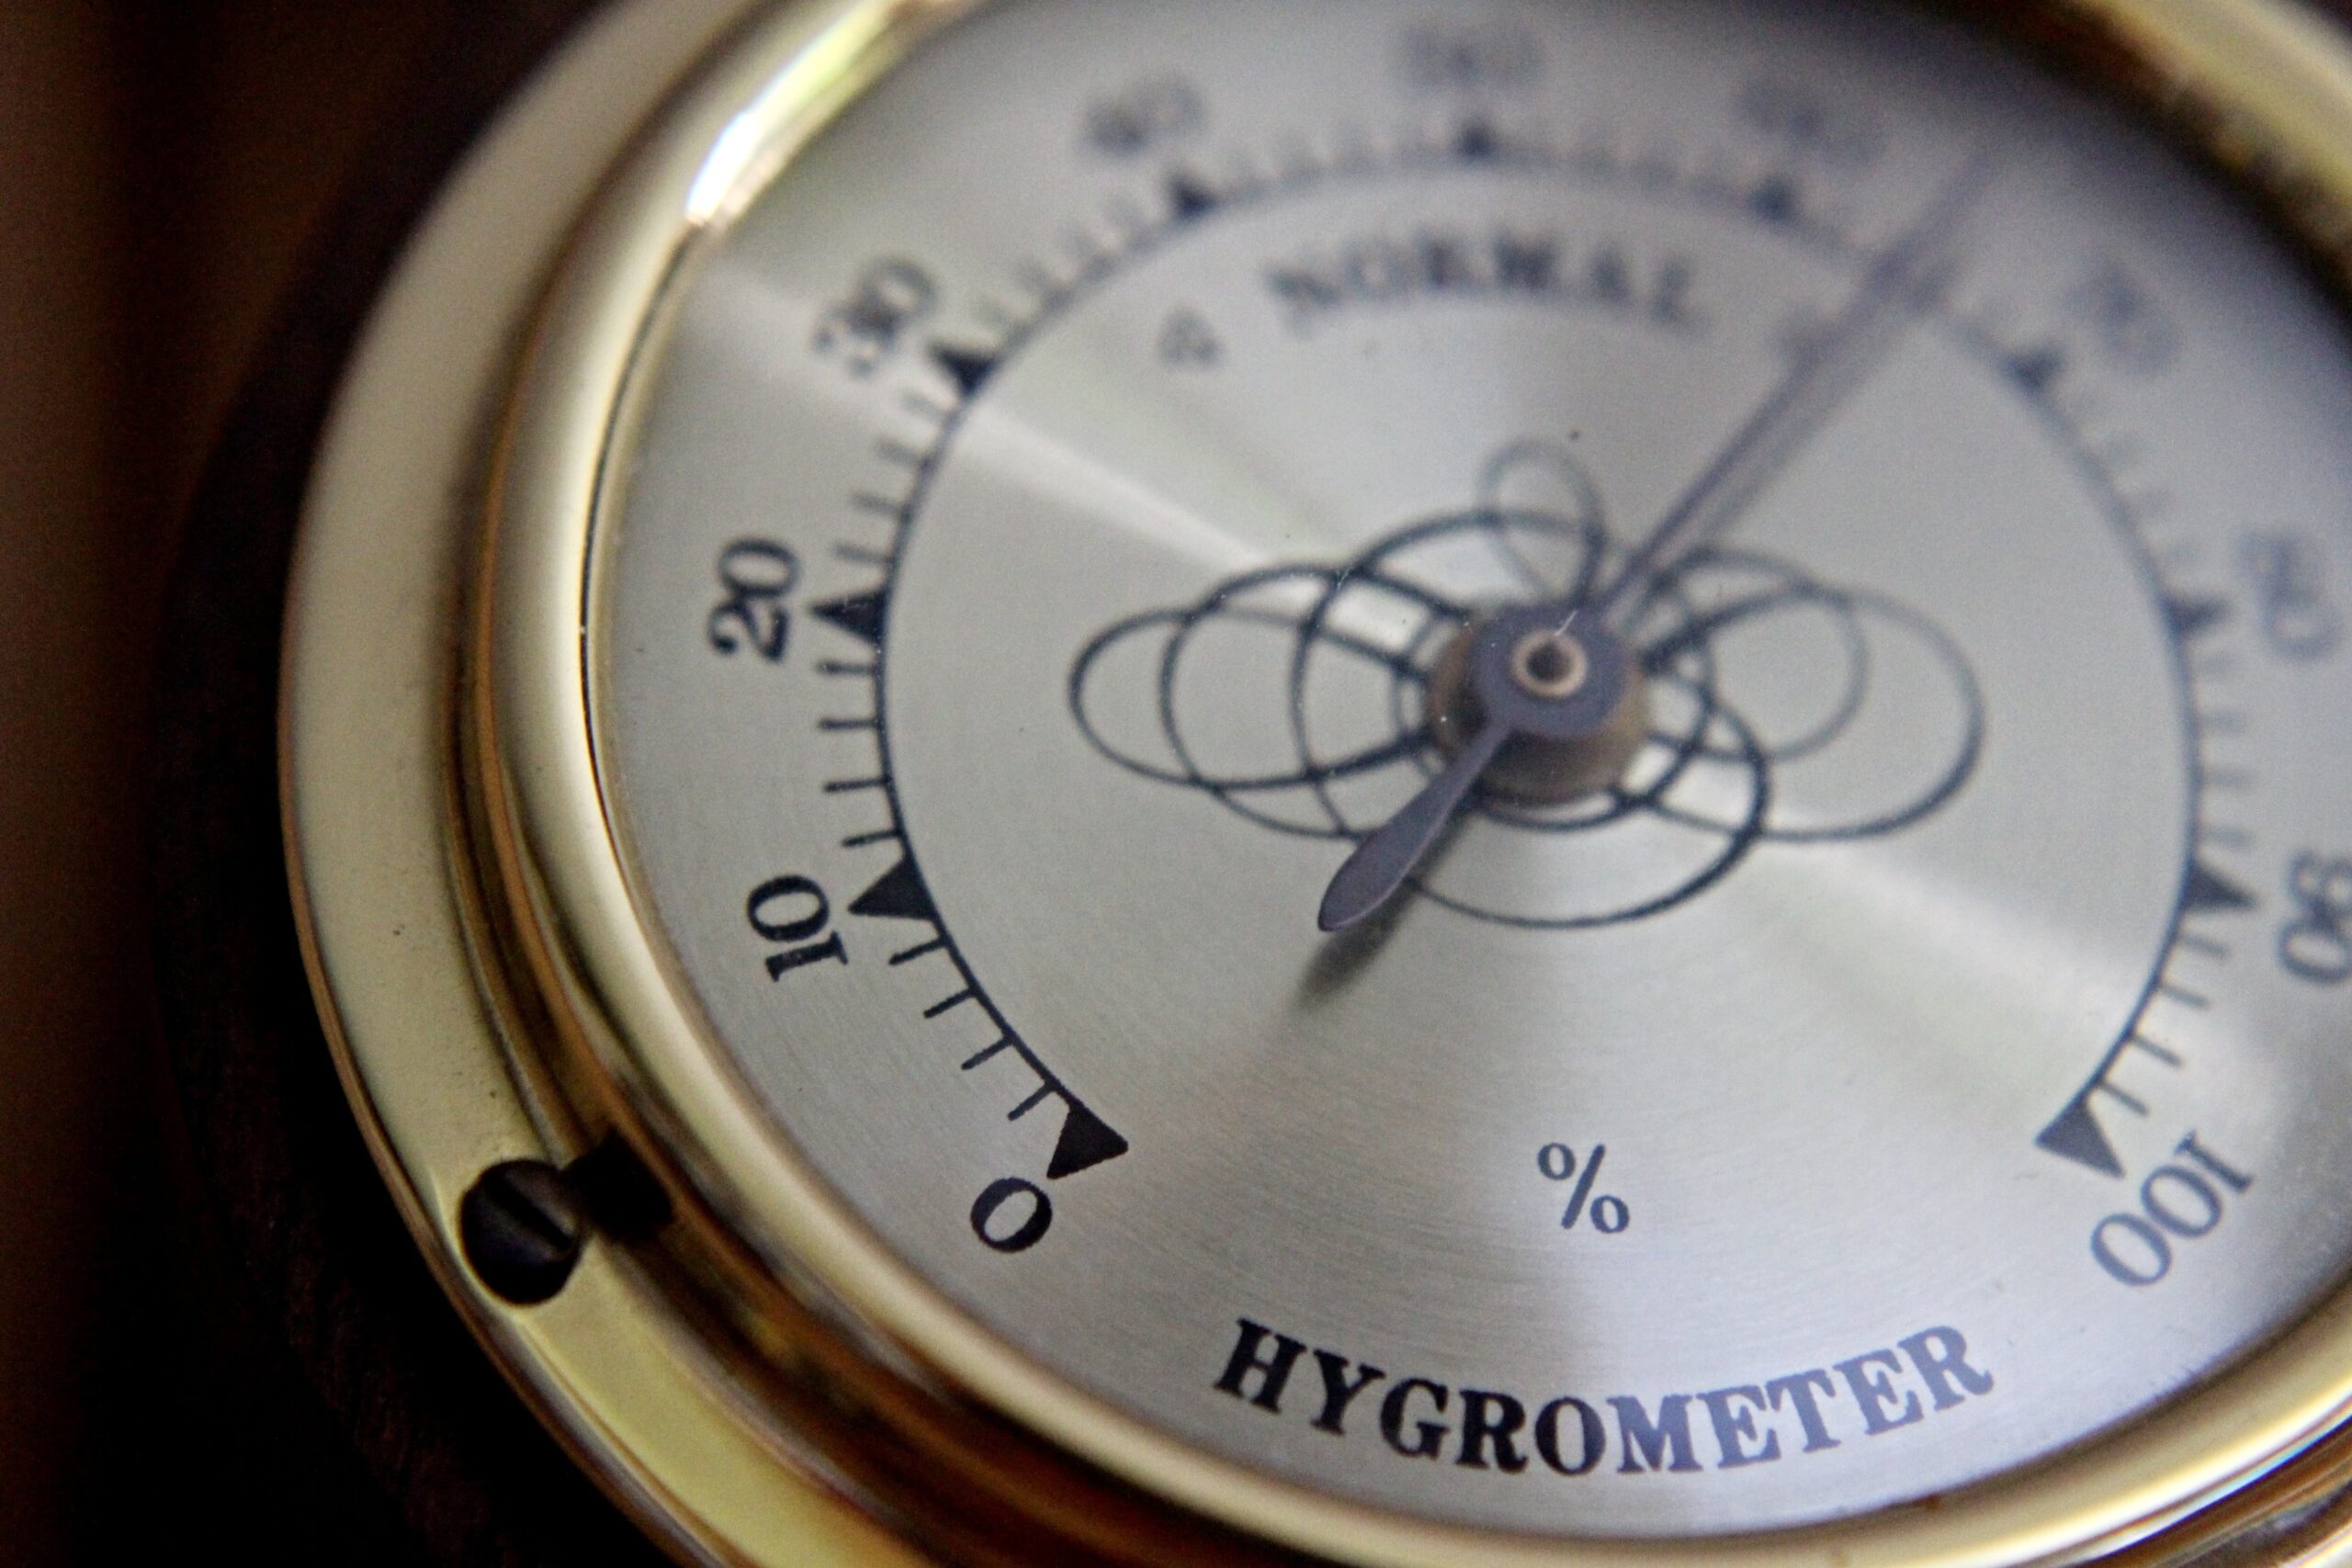
Main image: Hygrometer photo by Raphael Schaller from Pixabay
PREV
NEXT
Comments
Advertisements

Recent news
- Beijer Ref appoints new CEO
- Building ministers pledge NCC modernisation
- Recognising and celebrating progress and change
Latest events
- Recognising and celebrating progress and change
- Adam Morgan shines in Shanghai
- IOR opens nominations for J&E Hall Gold Medal
Leave a Reply